ATO 2022 – By the Numbers

While we weren’t quite sure what to expect when registration opened up back on June 14, we’re thrilled (and thankful) to say ATO 2022 turned out to be tremendous.
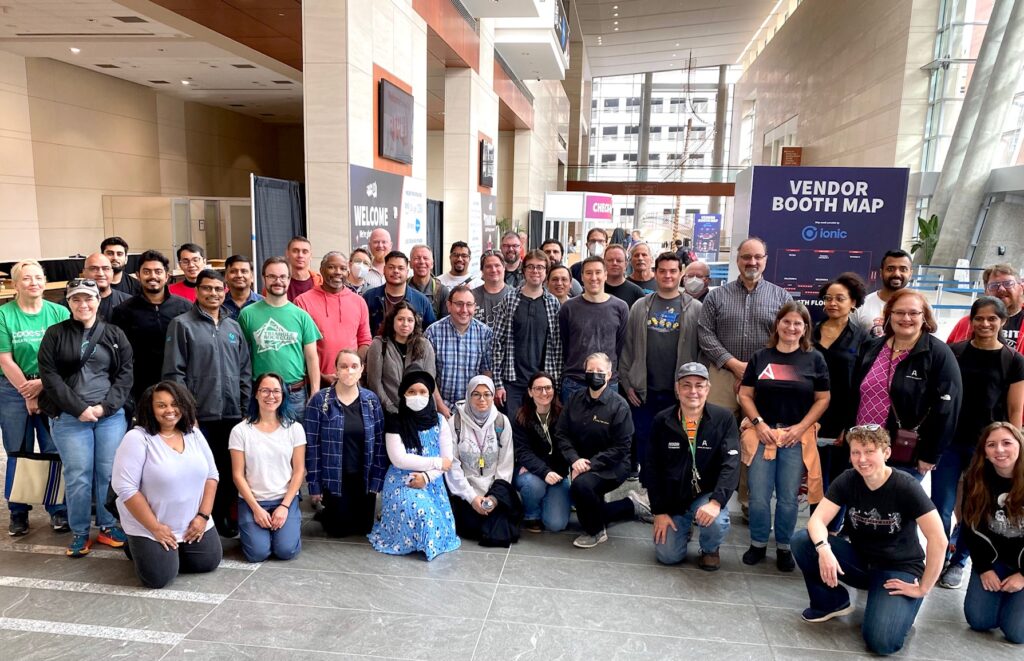
Both in-person and virtual attendance was strong, and it was beyond wonderful to see so many smiling faces. In addition, both co-located events (Inclusion & Diversity and Community Leadership Summit) and the extended workshops were very well attended as well.
Check out the stats below, and let us know if you have questions at info@allthingsopen.org.
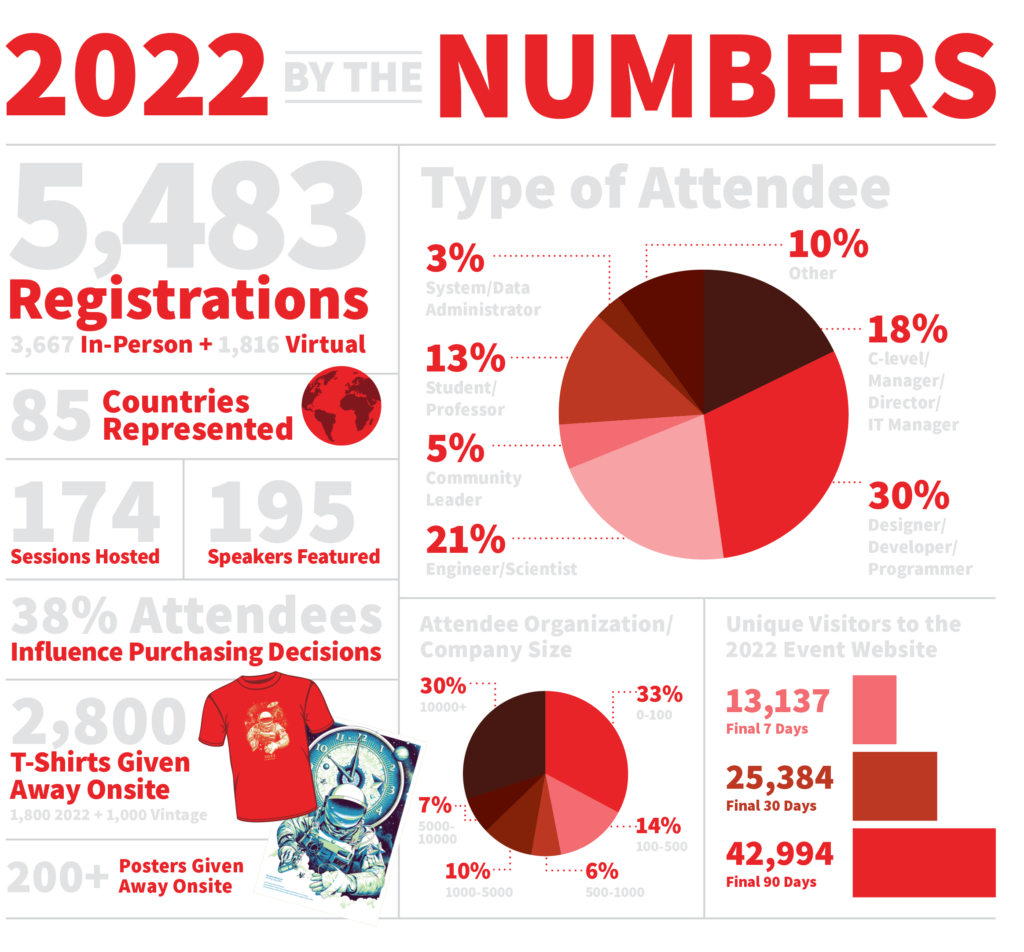
ATO 2022 By the Numbers
Total Registrations – 5,483
In-Person – 3,667
Virtual – 1,816
# of Countries Represented – 85
Attendee Type Breakdown
C-level/Manager/Director – 18%
Designer/Developer/Programmer – 30%
Engineer/Scientist – 21%
Community Leader – 5%
Student/Professor – 13%
System/Data Administrator – 3%
Other – 10%
Do you influence purchasing decisions?
Yes – 38%
No – 62%
# of Sessions Hosted – 174
# of Speakers Featured – 195
What size is your organization?
0-100 – 33%
100-500 – 14%
500-1,000 – 6%
1,000-5,000 – 10%
5,000-10,000 – 7%
10,000+ – 30%
Unique Visitors to the Website
final 7 days – 13,137
final 30 days – 25,384
final 90 days – 42,994
Total # of T-shirts Given Away Onsite – 2800
2022 t-shirts – 1,800
Vintage t-shirts – 1,000


